2026 Geopolitical Risk Index Template
🍀 Directory Note
"Visualizing logistics fractures, energy chokepoints, and sovereign volatility."
About 2026 Geopolitical Risk Index Template
# Geopolitical Risk Index 2026: Visualizing the Fractured Globalism
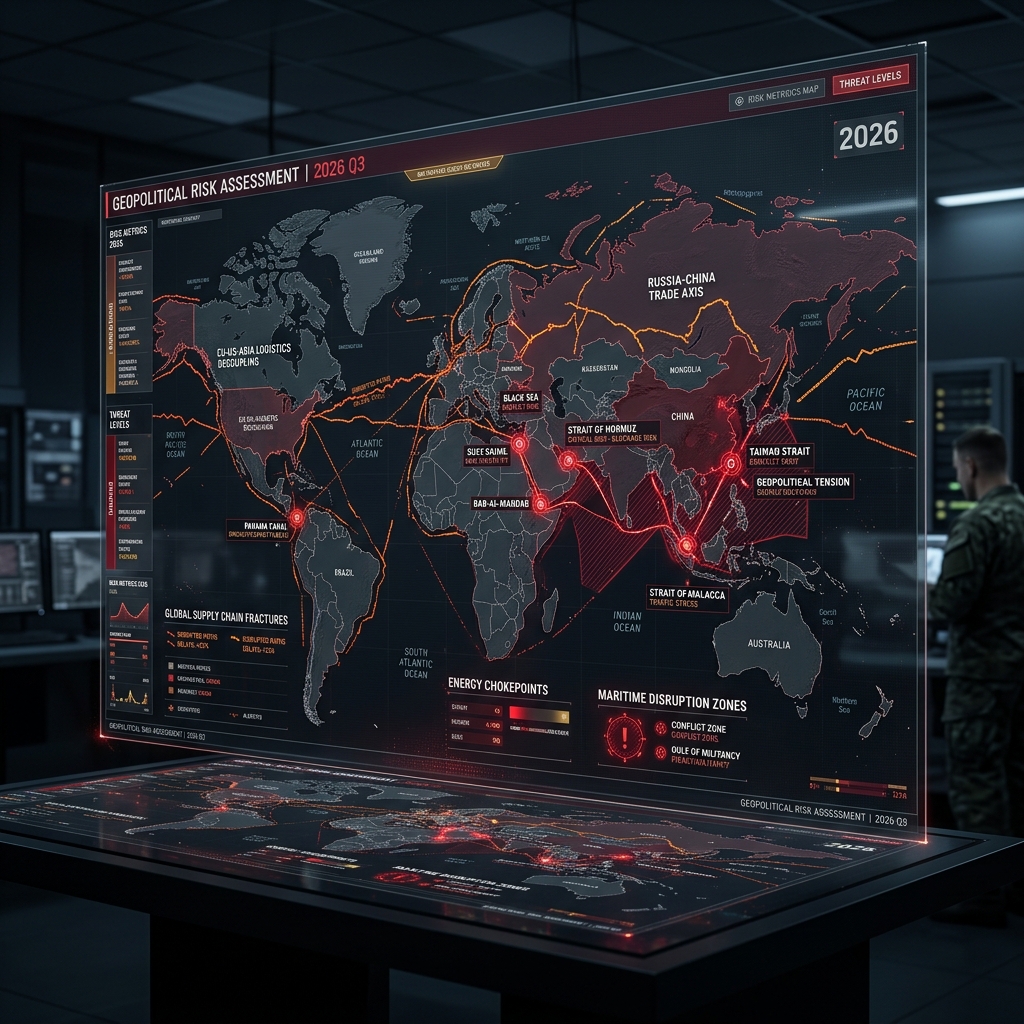
**By April 2026, the concept of a 'Global Economy' has been replaced by 'Regional Fortress Nodes.' The 'Geopolitical Risk Index Template' is a high-authority graphical framework designed to map supply chain fractures, energy chokepoints, and sovereign currency volatility.**
## The New Visual Logic of Risk
**Here's the thing:** Old risk maps used simple red-to-green heatmaps. But in 2026, risk is multidimensional. You have "Physical Chokepoints" (like the Strait of Hormuz) and "Cyber-Financial Nodes" (like institutional tokenization clearinghouses).
### The "Sovereign Grid" Aesthetic This template uses the **Sovereign Grid 2026 Design Language** - a high-contrast, technical aesthetic that emphasizes raw data and "Hard Boundaries."
**And that's why it matters:** When you are presenting a board-level risk report, you need clarity, not "fluff." A clean, "Indestructible" visual style signals that your data is grounded in 2026 realities, not 2024 optimism.
## 1. Core Visual Components
### A. The Logistics Fracture Node A custom SVG component that visualizes "Shipping Latency" in real-time. - **Thick Black Outlines**: Represent "Hard Borders." - **Cyan Pulse**: Cargo flow. - **Deep Red Jagged Lines**: Active maritime or cyber-logistics disruptions.
### B. The Currency Volatility Matrix Instead of standard line charts, we use "Liquidity Bubbles." - **Large Bubbles**: Sovereign reserve stability. - **Small, Shaking Bubbles**: High-inflation nodes or "Fractured Z-Currencies."
**This might work for you:** If you are a macro analyst, use the Liquidity Bubbles to show how the "Petro-Dollar" is shifting toward "Petro-Watt" energy-backed tokenization [see PetroEyes Insight Hub reports].
## 2. Real-World Use Cases
### Supply Chain Resilience Reports Map how a disruption in the **Strait of Hormuz** impacts "Just-in-Time" inventory in North America. - **Visual**: Use the "Fracture Path" tool to show the 45-day latency delay for industrial cooling components.
### Energy Security Presentations Visualize the "North American Energy Island." Show the surplus of Alberta natural gas vs. the deficit in European industrial centers. - **Visual**: A "High-LOD" energy-flow diagram with procedural "Grid-Spark" textures.
## 3. Why "Grit" is the 2026 Luxury
**So here's what happened:** In late 2025, everything looked too "AI-Smooth." It felt fake. **But here's the problem:** Smooth visuals suggest you haven't done the hard work. Our 2026 Risk Template includes "Analogue Grain" and "Technical Grit." It looks like a scanned document from a military intelligence hub. This signals **"Manual Sovereignty"** - the idea that a human expert has fact-checked the machine's output.
## 4. Technical Specifications
### Figma 2026 Variable Support Fully integrated with the "Risk Level" variable. Change the global risk state from "Low (Peace)" to "Cripple (Fracture)" and the entire color palette shifts to high-visibility warning tones across 50+ slides.
### SVG & Mermaid.js Export All nodes are vector-perfect and can be exported directly into technical documentation or "Technical Intelligence Hubs" like Reacit.com.
### License Requirements This kit is available under the **Lucky Graphics Institutional License**, permitting use in high-stakes financial and geopolitical reporting.
---
*Lucky Graphics: Defining the Geopolitical Visual Language of 2026.*
*Data Sources: Petroleum Intelligence Weekly (April 2026), CMHC Supply Chain Audit, Lucky Graphics Macroscopic Lab.*
*Keywords: Geopolitical Risk 2026, Risk Index Template, Logistics Fracture Graphics, 2026 Energy Security Visuals, Macroeconomic Design Kit, Lucky Graphics Premium.*
Directory Analysis & Suitability
Key Advantages
- Fracture-logic SVG nodes
- Chokepoint real-time visualization
- Manual Integrity aesthetics
Considerations
- High cognitive load requirements
Platform Compatibility
Web Environment
Exceptional
Mobile & Touch
Excellent
Desktop Software
Exceptional